

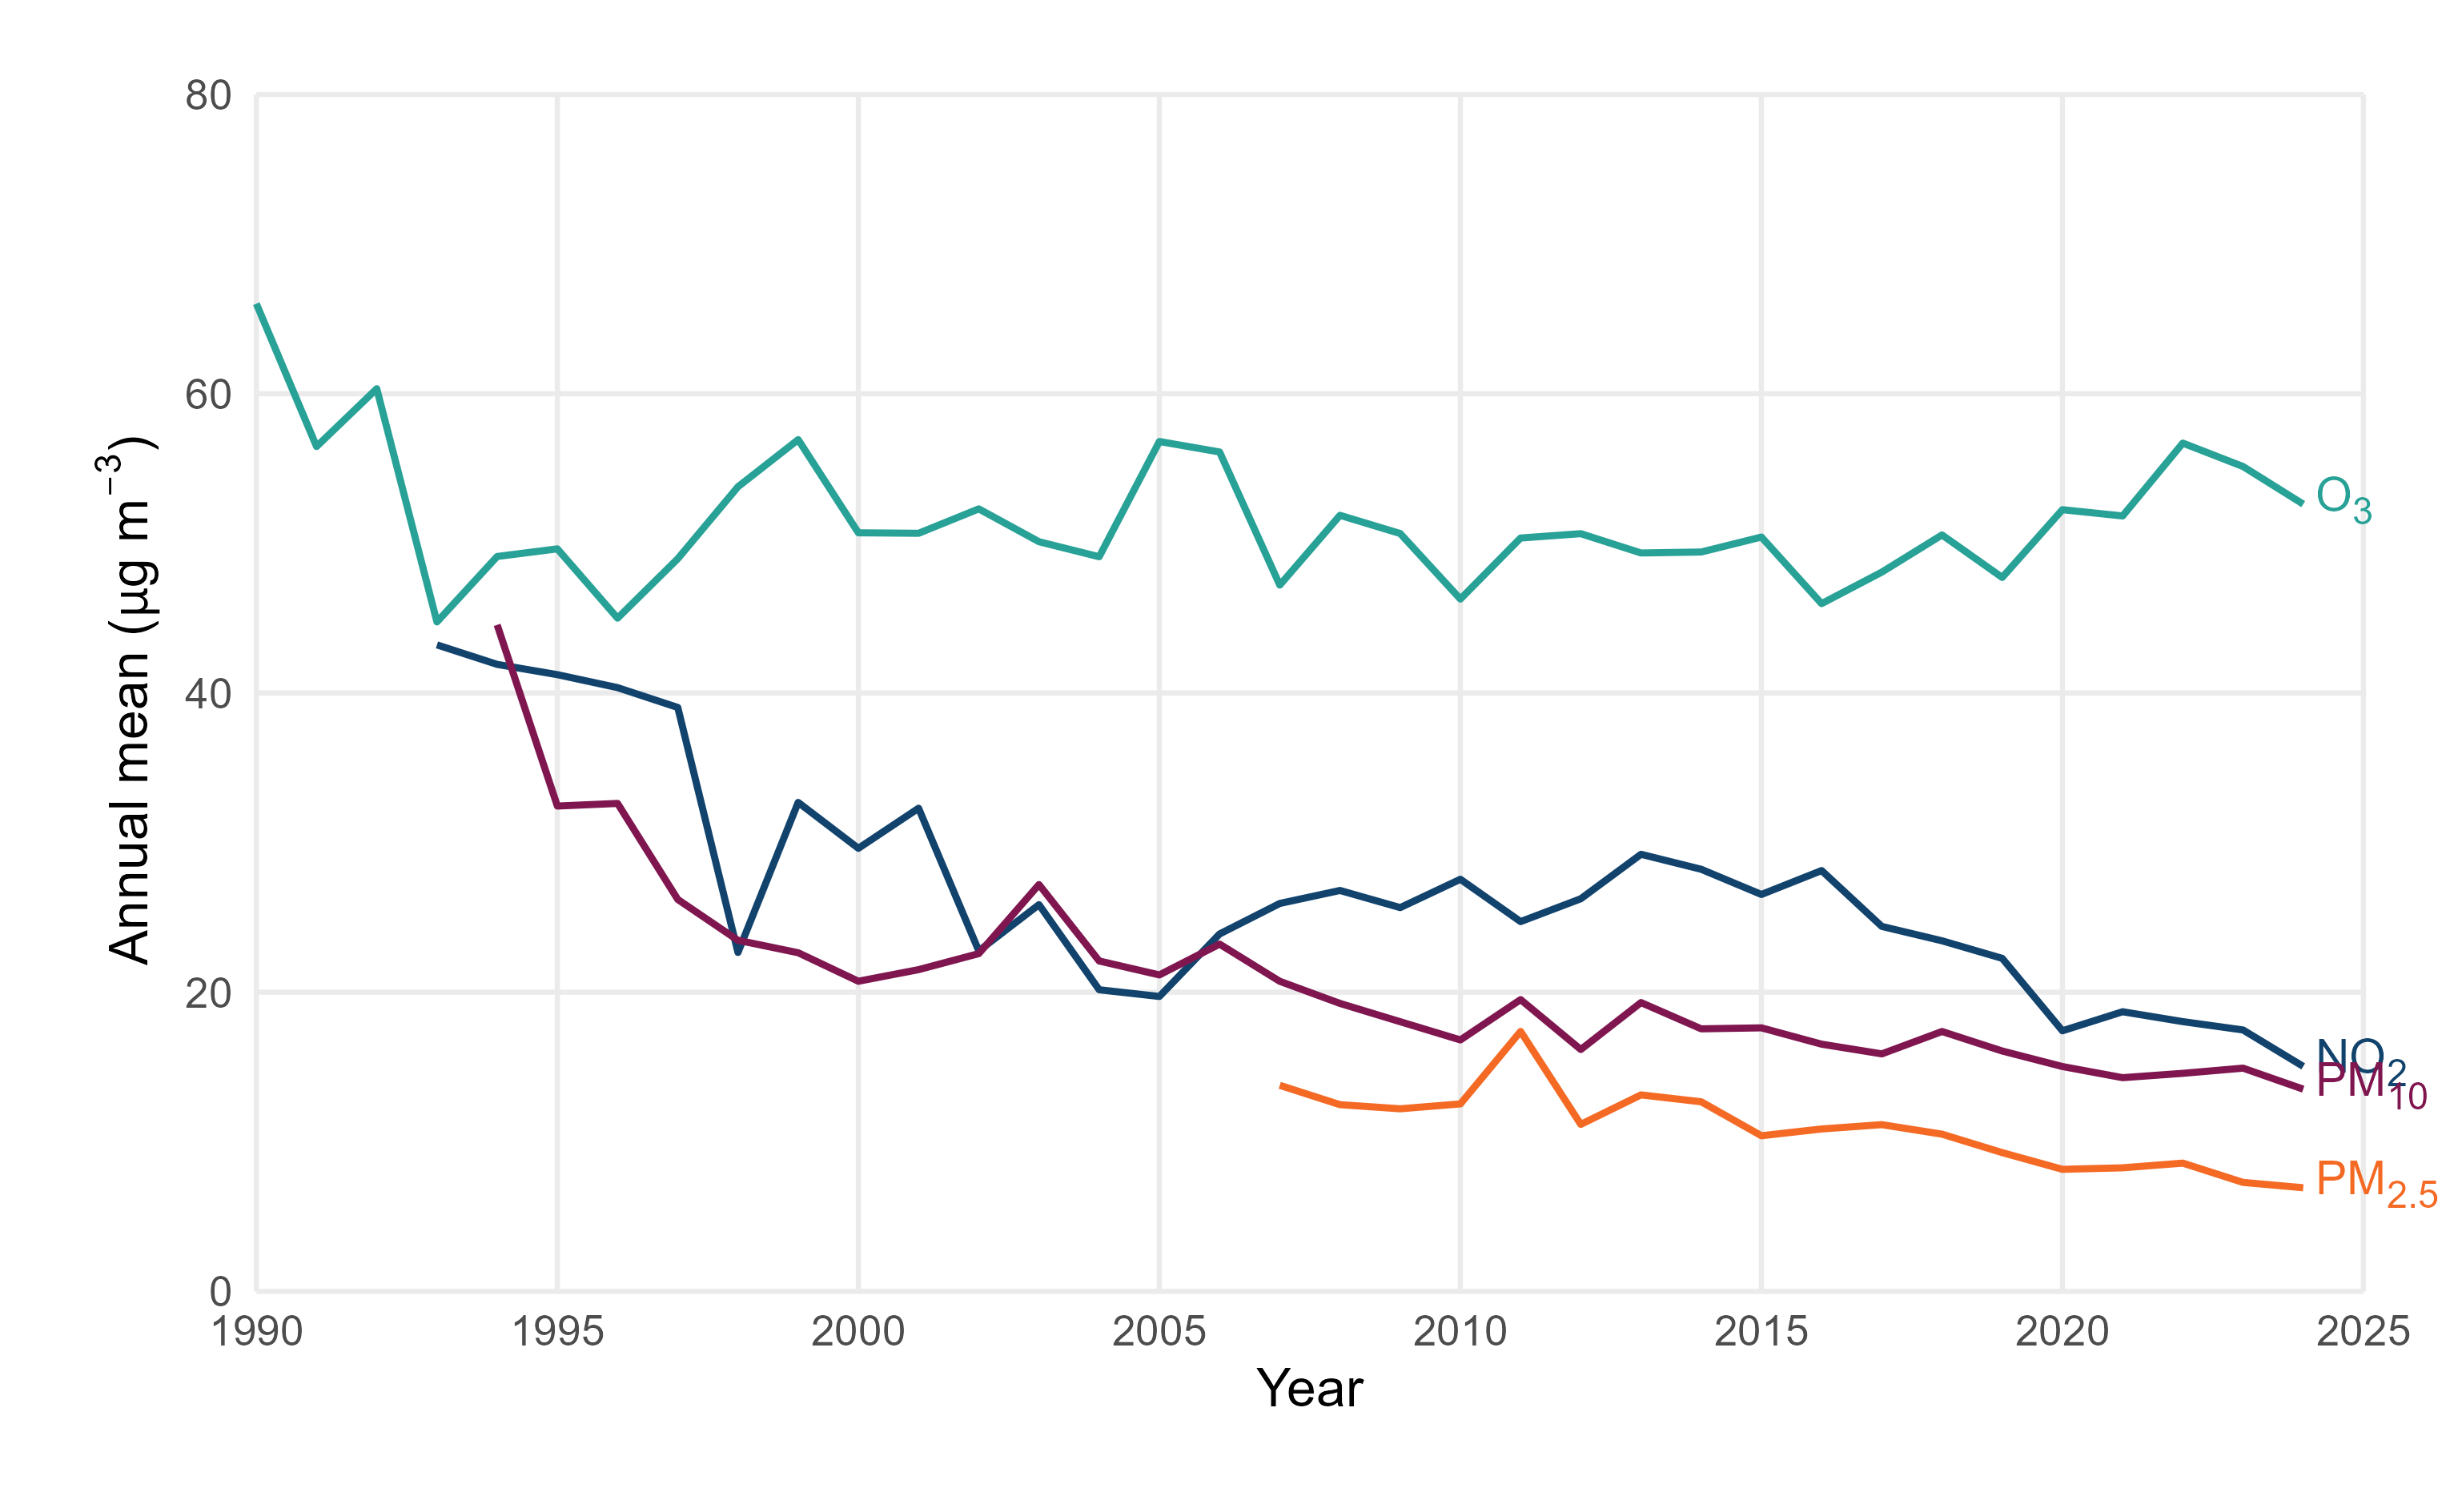
The Welsh Government and the Welsh Air Quality Forum (WAQF) work closely with air quality experts and the Department for Environment, Food and Rural Affairs (Defra) to monitor and reduce air pollution in Wales. The figure below illustrates the long-term trends for nitrogen dioxide, particulate matter up to 10 µm in size (PM10) and ozone concentrations in Wales. Apart from ozone this shows a steady improvement in pollutant concentrations since the 1990s. As ozone is a regional pollutant that is transboundary in nature, it is outside the direct control of the Welsh Government and Local Authorities.
Local Authority Monitoring
Air quality monitoring in Wales is undertaken by Local Authorities and through national networks managed by the Welsh Government. There are two main types of air pollution monitoring – automatic monitoring and passive sampling. Automatic monitoring uses continuous analysis techniques to measure and record ambient concentrations of a range of air pollutants. Passive samplers (such as diffusion tubes) contain a chemical reagent that adsorbs the pollutant from the air. Samplers are exposed for a period of time and analysed in a laboratory. At the start of 2024, there were a total of 37 automatic monitoring sites distributed across the country that were operated by Local Authorities, by the end of 2024 this increased to 43 sites.
These sites contain equipment that automatically measures carbon monoxide, nitrogen oxides, sulphur dioxide, ozone, PM10 and particulate matter up to 2.5 µm in size (PM2.5). In addition to these, there were several hundred diffusion tubes measuring monthly mean nitrogen dioxide levels. Overall, data capture for the automatic instruments operated by Local Authorities during the year was 83%.
In 2023, Ambient concentrations of PM10 were “Moderate” on 34 days, “High” on 11 days and “Very High” on 4 days (as defined by the Daily Air Quality Index bandings). For NO2 and SO2, there were no “Moderate”, “High” or “Very High” levels recorded. There were 33 days with "Moderate" ozone, 1 day with “High” and no days recorded as “Very High”, as measured by the monitoring sites operated by Local Authorities. Overall, pollution levels in Wales were low for 291 days, moderate for 59 days, high for 12 days and very high for 4 days. So, for 80% of the time, pollution levels were low across the whole of the Wales. Details of the Daily Air Quality Index banding system used to describe pollution levels for the public during 2024 can be found at https://airquality.gov.wales/about-air-quality/daily-air-quality-index
Summary of Exceedances
Exceedance statistics generated from the 'Air Quality in Wales' website show that no monitoring sites in Wales exceeded any Air Quality Strategy (AQS) Objectives for NO2, PM2.5, carbon monoxide, sulphur dioxide, benzene or lead during 2024.
Three sites in Wales exceeded the AQS Objective for O3 (100 µg/m3 as a maximum daily 8-hour mean) on more than the permitted 10 occasions. These were Aston Hill, Cardiff Centre, Narberth, Marchlyn Mawr, Port Talbot Margam and Swansea Cwm Level Park. These exceedances mainly occurred across three prominent high-ozone periods during May, July and August 2024.